3 Attribution Models You Can Build in a Spreadsheet (With the Formulas, Not the Vendor Lock-In)
Contents
A B2B SaaS (Software as a Service, 订阅制软件) client came to me in 2023 convinced Google Ads was their best channel. Their last-click report said so — 60% of conversions came through Branded Search, which they had cleverly defined as anything containing their company name. The board believed them. The CFO (Chief Financial Officer, 首席财务官) approved a $400K quarterly budget on the back of that number. I spent one afternoon pulling the raw clickstream (点击流) and rerunning it through three attribution models in a Google Sheet. The answer was almost the opposite: paid social was doing the opening 73% of conversions, and branded search was getting credit for the close. The same data, three different models, three different strategic decisions.
That is the whole problem with marketing attribution in 2025. There is no "right" model, but there are definitely wrong ones, and most of the wrong ones are being sold to you by vendors with $50K/year seats. You do not need them. The three models that actually drive decisions — last-click, first-click, and time-decay — can be built in a spreadsheet in an afternoon. I have been building them for clients since 2014. The math has not changed. The vendors charging for it have not improved.
This post walks through the three models, the exact formulas, the column setup, and the one trap that catches everybody (myself included, twice). If you finish this and build the model for your own data, you will have something most in-house marketing teams do not: an attribution model you can defend in a budget meeting, with math that holds up to a finance team's scrutiny.
Why "right" attribution is a fantasy (and what to do instead)
A perfect attribution model would know that your customer heard a podcast ad on Tuesday, Googled your brand on Thursday, opened three marketing emails over the weekend, and finally converted on Monday after a colleague mentioned you in a Slack DM. It would weight each touchpoint by its actual causal contribution. It does not exist, and probably will not, because half of the inputs are in people's heads and you cannot instrument a Slack DM.
What you can do — and what every working marketer I know actually does — is pick one or two attribution models, be honest about their biases, and compare the answers. When three models point in the same direction, you have a decision. When they disagree, you have a question worth investigating, not a number to argue about.
The three I keep coming back to:
- Last-click attribution — 100% of conversion credit to the final touchpoint. Simple, biased toward bottom-funnel (漏斗底部) channels, but it is the model your boss's boss uses, so you have to speak it.
- First-click attribution — 100% of credit to the first touchpoint. Biases toward awareness (认知) channels. Useful for understanding "where do customers come from," useless for bid optimization.
- Time-decay attribution — credit distributed across touchpoints, weighted by recency. Closer to how customers actually behave on long consideration cycles. My default for B2B (Business to Business, 企业对企业) with a 30+ day sales cycle.
A fourth model — data-driven / Shapley value — exists, and Triple Whale, Northbeam, and Rockerbox will all sell it to you. I have used it. It is genuinely better mathematically, but it requires a clean clickstream database and a part-time data engineer. For under $5M/year in ad spend, the spreadsheet models give you 80% of the insight for 0% of the engineering cost. The diminishing returns are steep.
The data you need before you build anything
You can build all three models in one Google Sheet if you have one export: a click-level (or session-level) log that includes these four columns at minimum.
| Column | Example | What it tells the model |
|---|---|---|
user_id (or email_hash) |
a3f8c92 |
Which journeys belong to the same person |
event_type |
click or conversion |
What happened |
channel |
paid_search, organic, email, direct |
Which marketing channel fired |
timestamp |
2024-11-03 14:22:01 |
When it happened, in order |
Optional fifth column: campaign (e.g. google_brand_us_q4). I almost always add it.
Where to get it. If you are running Shopify, Klaviyo, and Meta Ads, you can stitch this together with the Shopify customers export + Klaviyo activity export + Meta Ads insights export. The cleaner path: turn on GA4 (Google Analytics 4) event tracking and pull the BigQuery export. The even cleaner path: use the Rockerbox or Triple Whale pixel for 30 days, pull the raw event log, then build your own model. I do not recommend staying on a vendor for this; their free export tier is enough for what I am about to show you.
A data hygiene (数据卫生) warning: dedupe by user_id and timestamp. If a single user opens an email and clicks a link in the same minute, GA4 records two events. For attribution purposes, collapse them into one touchpoint. I learned this the hard way in 2018 when an email blast made a customer look like they had interacted with nine channels before converting. They had interacted with one.
Model 1: Last-click attribution (the one you already have, but explicit)
The math is trivial, but writing it out forces you to commit to the column logic — which is where most teams quietly differ.
Step 1. Filter to events where event_type = "conversion". For each conversion, look up the last click event by that user_id before the conversion timestamp. That channel gets 100% credit.
In a Google Sheet:
=SORT(FILTER(events!A:D, events!B:B="conversion"), 4, TRUE)That gives you conversions sorted newest-first. Then for each conversion, you need the immediately preceding click for that user. A formula trick I use, assuming your events sheet is events!A:D and the conversion row is row N:
=INDEX(
   FILTER(
      events!C:C,
      events!A:A = user_id,
      events!B:B = "click",
      events!D:D < conversion_timestamp
   ),
   COUNTA( FILTER(
      events!C:C,
      events!A:A = user_id,
      events!B:B = "click",
      events!D:D < conversion_timestamp
   ) )
)
Read that as: "give me the channel from the last click before this conversion for this user." The nested COUNTA returns the row count, which INDEX then uses to grab the final match.
Once you have a per-conversion "last click channel" column, the rest of the sheet is a SUMIF pivot:
=SUMIF(last_click_results!C:C, "paid_search", last_click_results!E:E)The honest bias. Last-click massively over-credits branded search, direct traffic, and email — anything that tends to be the final touch before purchase. It systematically under-credits podcasts, YouTube, display, and any upper-funnel (漏斗顶部) paid social. The branded-search-loving B2B client from the opening of this post is the canonical case. Use last-click as a baseline, never as a verdict.
Model 2: First-click attribution (the one that funds the awareness budget)
Same data, opposite lens. Find the first click event for each converting user_id, not the last. Give that channel 100% credit.
The formula is structurally identical, you just remove the timestamp filter:
=INDEX(
   FILTER(
      events!C:C,
      events!A:A = user_id,
      events!B:B = "click"
   ),
   1
)
The 1 at the end says "the first match in the filtered range." No need for COUNTA gymnastics — first-touch always has a single answer.
Why it matters. First-click tells you where customers originate — the channel that brought them into your ecosystem before any other influence. For a brand that runs an awareness podcast, this is usually the column that gets the podcast funded. For a B2B SaaS, it is often organic search or a specific LinkedIn campaign. First-click attribution is the answer to the question your CMO (Chief Marketing Officer, 首席营销官) asks when she defends the brand budget: "Where did these customers come from, originally?"
The honest bias. First-click ignores everything that happened between the first touch and the conversion. If a customer discovered you via a podcast, then spent three months being nurtured by email and retargeting, first-click still gives the podcast 100% credit. That makes it a useful budget-defense tool, and a useless budget-allocation tool. Use it to defend existing spend; do not use it to make new spend decisions.
Model 3: Time-decay attribution (the one I actually use)
This is the model I run by default. It distributes credit across every touchpoint, weighted so that touchpoints closer to the conversion get more credit. The standard implementation is a half-life formula: a touchpoint N days before conversion gets half the weight of a touchpoint 0 days before.
The half-life weighting formula:
weight = 2 ^ ( -(days_before_conversion) / half_life_days )Where:
days_before_conversion=(conversion_timestamp - touchpoint_timestamp)in dayshalf_life_days= how aggressively to decay. 7 days is the default most attribution vendors use. I use 14 days for B2B SaaS with a 30+ day sales cycle, 3-5 days for direct-response ecommerce.
Step 1 — assign weights in the events sheet. Add two columns:
days_before_conversion |
weight |
|---|---|
=conv_ts - event_ts (in days) |
=2^(-days_before_conversion / half_life) |
You need to know the conversion timestamp for each event's user. The cleanest way is a helper sheet user_conversions with user_id and conversion_timestamp, then VLOOKUP or XLOOKUP to pull it back.
Step 2 — normalize the weights per user. A single user has multiple touchpoints, each with its own weight. To turn those into percentages of credit, divide each touchpoint's weight by the sum of all that user's touchpoint weights:
credit_fraction = touchpoint_weight / SUM(touchpoint_weights_for_this_user)Step 3 — distribute the conversion value. If a conversion is worth $100 (use your AOV (Average Order Value, 平均客单价) for ecommerce, or your pipeline value for B2B), each touchpoint gets credit_fraction × $100. Sum across all users and all touchpoints by channel:
=SUMIFS(
events!G:G, -- credit column
events!C:C, -- channel column
"paid_search"
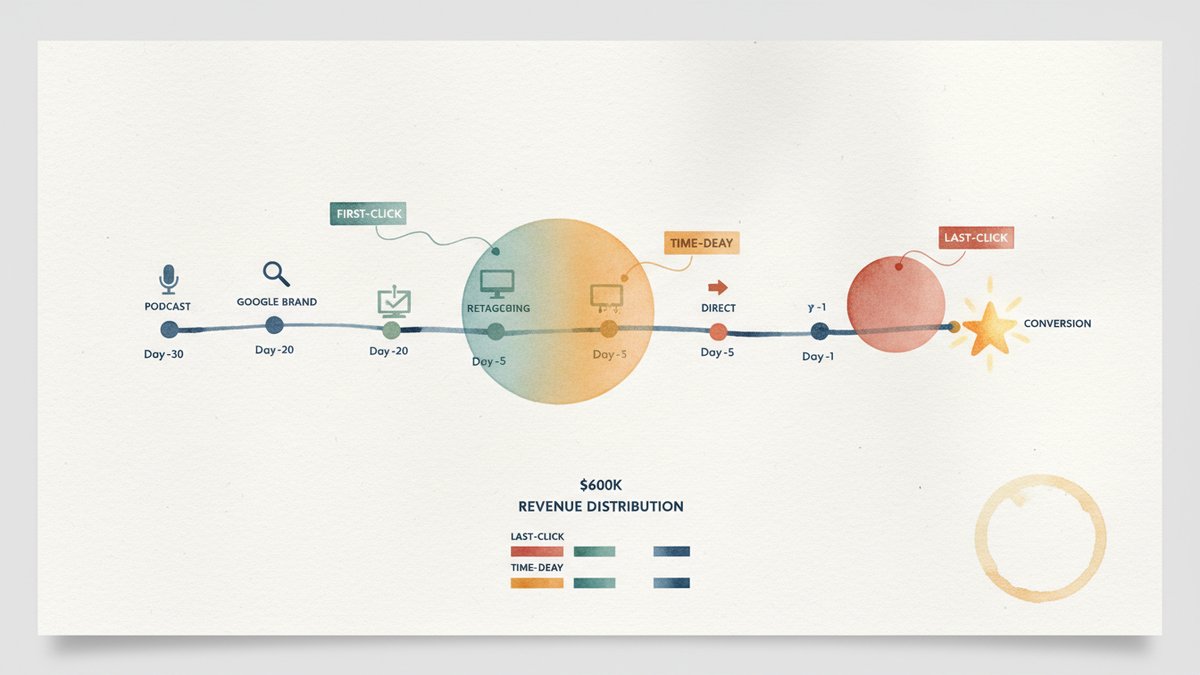
)A worked example. Customer journey: podcast ad on day -30, Google brand search on day -20, retargeting display on day -5, direct visit on day -1, conversion on day 0. With half_life = 7:
- Podcast:
2^(-30/7) ≈ 0.052 - Brand search:
2^(-20/7) ≈ 0.139 - Retargeting:
2^(-5/7) ≈ 0.610 - Direct:
2^(-1/7) ≈ 0.906
After normalization (each weight divided by the sum, so they total 100%): podcast 3%, brand 8%, retargeting 36%, direct 53%.
Direct still wins, but the retargeting and brand search get meaningful credit. The podcast gets crumbs, which is honest — a 30-day-old touchpoint on a 7-day half-life has decayed almost to zero. If you want the podcast to get more credit, lengthen the half-life. That is the lever, and the lever is yours.
Why time-decay is my default. It does not pretend the first or last touch is the only one. It weights recency, which roughly matches how a buyer's mental state evolves. It is computable in a spreadsheet without external tools. And it produces results the CFO accepts as "reasonable," which is non-negotiable in my experience.
The one trap: stitching identities
I built these models for a DTC (Direct-to-Consumer, 直接面向消费者) skincare brand in 2019. We were three weeks from a board meeting. The first model run said paid social drove 80% of conversions. I almost wrote the deck. Then I noticed the clickstream had 40% anonymous sessions — user_id = "anonymous_8f72c1" or similar. Anonymous sessions are normal in pre-purchase browsing. But they are poison for first-click attribution, because the first click for an anonymous user is not the first click for the eventual buyer.
The fix is identity resolution (身份识别): when an anonymous user gives you their email (newsletter signup, account creation, purchase), backfill their prior events with the new known user_id. Most ESPs (Email Service Providers, 邮件服务商) and CDPs (Customer Data Platforms, 客户数据平台) do this for you if you turn it on. Klaviyo does it on signup. Segment does it on identify(). If you are hand-rolling, it is a one-time SQL (Structured Query Language, 结构化查询语言) job: UPDATE events SET user_id = new_id WHERE session_id = old_session AND event_timestamp < signup_timestamp. I have a template for that exact query; the SQL is twenty lines and saves you from the mistake I almost shipped.
Run identity resolution before any model. Without it, first-click attribution becomes "which channel was anonymous user X browsing when they first hit our pixel" — which is noise.
What to do with three different answers
You will, predictably, get three different numbers. The skill is not picking one. The skill is reading the spread.
A real example from a 2024 client, a B2B SaaS in HR tech, $1.2M/year spend, three months of clickstream data:
| Channel | Last-click revenue | First-click revenue | Time-decay revenue |
|---|---|---|---|
| Branded search | $284K (47%) | $31K (5%) | $168K (28%) |
| Paid social (LinkedIn) | $62K (10%) | $214K (36%) | $134K (22%) |
| Organic search | $89K (15%) | $108K (18%) | $112K (19%) |
| $94K (16%) | $12K (2%) | $78K (13%) | |
| Direct | $58K (10%) | $61K (10%) | $56K (9%) |
| Podcast / PR | $13K (2%) | $174K (29%) | $52K (10%) |
| Total | $600K | $600K | $600K |
Totals match because every conversion is counted once. The interesting thing is the distribution.
Read the spread:
- Branded search is over-credit in last-click, under-credit in first-click. Time-decay sits in the middle, which is what I would actually believe. Verdict: it deserves real budget, but not the 47% the platform-default dashboard suggested.
- Paid social (LinkedIn) is the opposite — undervalued in last-click, overweighted in first-click. Time-decay confirms it is a strong mid-funnel (漏斗中部) driver. The right move: do not cut it (which the last-click report would have justified), increase it.
- Podcast / PR is the line item that disappears in last-click. It looks like a vanity expense. First-click says it brings in 29% of the customer base. Time-decay moderates that to 10%. The honest read: podcast is a strong awareness driver, weaker at the close. Worth keeping if brand matters to the business.
Three models, three lenses, one decision: rebalance the budget toward paid social and away from branded search, but do not kill the podcast. That is the kind of conclusion a spreadsheet gives you for free. The vendor version of the same analysis is a $40K/year contract with a 60-day implementation.
Limits of the spreadsheet approach
I want to be honest about what these three models do not solve.
- They are last-touch-family models, mathematically. Time-decay softens the last-touch bias but does not eliminate it. A truly causal attribution model would weight channels by their incremental contribution — what would have happened if you had not run that channel at all. To answer that question you need holdout tests (关停测试) or geo-lift experiments, not a spreadsheet.
- They cannot see offline. A customer who heard about you from a conference and then Googled your brand looks like a "branded search" customer in your clickstream. The model has no idea the conference existed. If your business has heavy offline influence (B2B sales, retail, events), you have to add a "lift study" channel on top.
- They collapse to channel-level. All three models tell you "paid social is worth X% of revenue." They do not tell you which campaign within paid social is doing the work, which creative is converting, or which audience segment is the highest-LTV (Life Time Value, 用户终身价值). For that, you still need platform-level breakdowns and incrementality testing.
The biggest honest mistake I have seen teams make with these models: they build them, get a number, and stop. The number is a starting point, not an answer. The right next move is always to ask "what would have to be true for this to be wrong?" If the model says paid social is the best mid-funnel channel, the falsifiable claim is "if I paused paid social for two weeks, conversions would drop at least 15%." Go run that pause. If conversions hold, the model is wrong. If they fall, the model is right and you just earned the right to scale.
The version I would build today
If I were starting from zero, this is the order of operations:
- Pull a clickstream export from GA4 → BigQuery, or stitch a 30-day Rockerbox / Triple Whale raw event log. Save it to one sheet, four columns minimum.
- Run all three models in three separate tabs. Last-click, first-click, time-decay. Each tab is
SUMIFover channel × credit. - Build a comparison pivot. Channel rows, model columns. Look at the spread. That is the analysis.
- Run one falsification experiment — pause a channel for two weeks and measure the delta. Compare the actual delta to the model's prediction. If the model said paid social drives 22% of conversions, a 15-25% drop in a clean pause is a green light. Anything outside that band means the model is mis-weighting something.
- Update the model quarterly. Half-life drift, channel mix changes, product launches — all of these shift the weights. A model from six months ago is folklore.
None of this needs a vendor. None of this needs a data engineer. The most expensive part is your afternoon, and the second-most-expensive part is the discipline to actually run the pause test, which is where most teams quietly stop.
The contrarian ending: the value of an attribution model is not the model itself, it is the pause test the model forces you to design. A model that nobody acts on is a screenshot in a Notion doc. A pause test is a board-meeting-grade experiment. Build the spreadsheet, then build the experiment, and the spreadsheet will pay for itself in the first quarter.