Funnel Drop-Off Diagnosis: Find the Leak in 7 Steps (Claude + GA4)
Contents
A 71% drop. That was the number sitting on the screen last month when a SaaS client forwarded me a screenshot of their signup funnel. Out of 12,400 visitors who hit the pricing page, only 3,580 clicked "Start Free Trial," and of those, 1,022 actually completed account creation. The CEO's message above the screenshot was four words: "Where is the leak?"
The instinct on a team like that is to redesign something. Rewrite the headline, redesign the form, ship a new pricing tier. I have watched well-funded teams spend eight weeks doing exactly that, only to discover after launch that the leak was the email-verification step that nobody had instrumented, or a 6-second mobile render on a 4G connection, or a payment processor outage that hit 2% of users but skewed the average badly.
Funnel diagnosis is not a creative problem. It is a forensic problem. You are looking for a specific failure in a specific segment of a specific step, and the only way to find it is to keep cutting the data in new directions until one of them tells you something. GA4's Funnel Exploration report gives you the shape of the leak. Claude, with the right prompt, does the cross-segmentation and hypothesis generation that would otherwise take a human analyst a full afternoon. Together, they get you from "the funnel is broken" to "I know which 8% of users to fix first" in under two hours.
This is the seven steps I run. I learned most of them the hard way.
Step 1: Define the funnel as events, not pages
The single biggest mistake in funnel analysis is treating the funnel as a sequence of URLs. A page-view funnel will tell you "we lost users between /pricing and /signup" but it cannot tell you why, because none of the interesting reasons are in the URL. Users abandon because the form took 9 seconds to validate, because the CTA (Call To Action, 行动召唤) button was below the fold on a 6.1-inch screen, because their session expired, or because the price changed mid-flow. All of that lives in events.
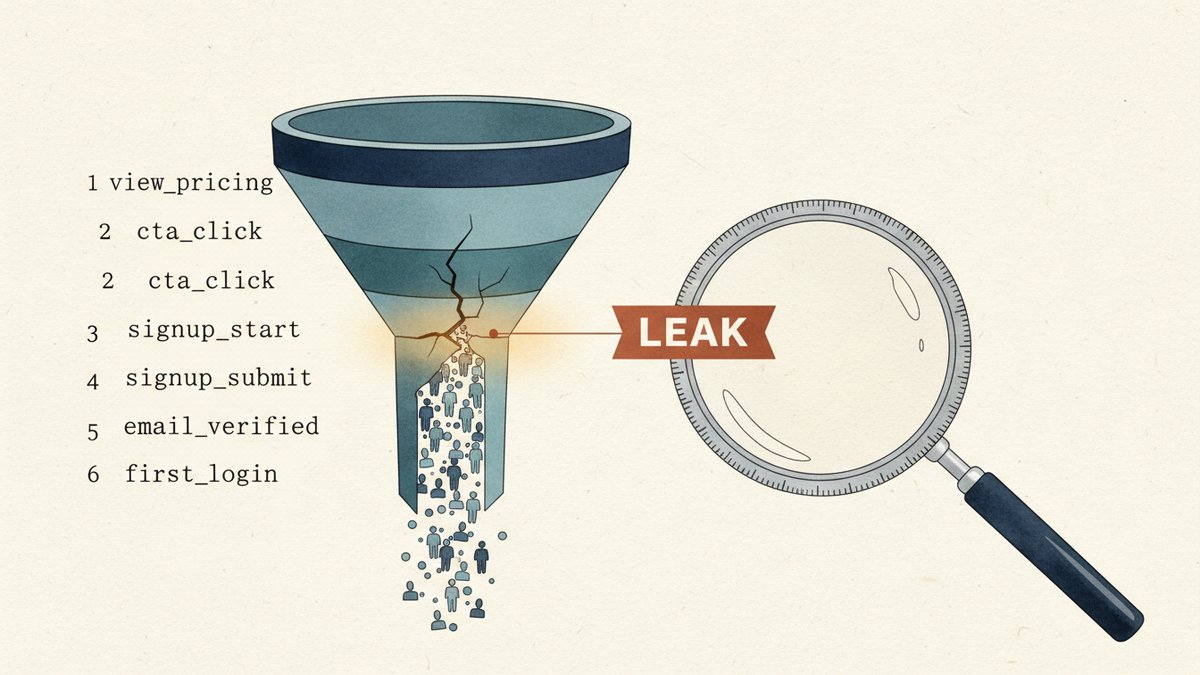
Before you do anything else, write down the four-to-six events that define your funnel, in the exact order the user must complete them. For a B2B SaaS free trial, mine is usually:
view_pricing(custom event fired on pricing page view)cta_click(event with a label of "start_trial")signup_start(first field focus or page view of/signup)signup_submit(form submit, success or fail)email_verified(custom event when verification link is clicked)first_login(custom event on dashboard first paint)
If you do not have custom events for these, build them first. Instrumenting a funnel after the leak has already started is like installing a security camera after the burglary. Use GTM (Google Tag Manager) dataLayer pushes, or have engineering fire the events directly. This step is non-negotiable and usually takes a developer 2-4 hours. Worth every minute.
Step 2: Build the funnel in GA4 Funnel Exploration
Open GA4, go to Explore → Funnel exploration, and configure your six steps in order. A few settings most people get wrong:
- Use "make this a closed funnel" only if you truly need it. Closed funnels are stricter — a user who skips a step counts as dropped. Open funnels are more forgiving and usually match what your business actually wants to see. Default to open, switch to closed only when you suspect users are exploiting step-skipping (rare outside of media sites).
- Set the lookback window to match your real cycle. A 7-day window is the GA4 default and almost always too short for considered purchases. For a B2B trial signup with a 3-day median time-to-verify, set it to 30 days or you will mis-classify a huge chunk of legitimate users as drop-offs.
- Add a breakdown dimension from the start. I always add
Device category(mobile/tablet/desktop) as a row dimension. Within two clicks this answers "is the leak on mobile only" which is the most common answer in mobile-traffic-heavy businesses.
When you save it, you will see a six-bar chart. The first thing to write down is the absolute drop rate between each adjacent step. In the client example above, the worst was step 2 → 3 (CTA click → signup start) at -71.2%. That single number became the entire investigation.
Step 3: Cross-segment by traffic source
Now that you know where the drop is, you need to know who is in it. The fastest way: pull a second Funnel Exploration that breaks down each step by Session source / medium. Compare the drop rates for paid search, organic, email, and direct at the leaking step.
For my client, the breakdown was not what anyone expected. Paid search had a 58% drop, organic was 73%, and email was 64% — but the volume of paid search was 4x organic, so paid search was contributing 71% of the lost users in absolute terms. The CEO's instinct had been to look at organic (the channel with the worst rate), but the math pointed at paid. This is the part Claude accelerates dramatically.
The prompt I use for this segmentation pass is roughly:
You are a funnel analyst. Below is a GA4 Funnel Exploration export (CSV attached) broken down by session source/medium for the leaking step. Identify (1) which segment has the highest absolute loss, (2) which has the worst relative drop rate, (3) any segments where the drop is more than 1.5x the channel average, and (4) the single segment I should investigate first. Output as a short bulleted brief — three to five bullets max.
Claude typically produces the brief in 30-40 seconds. The "1.5x the channel average" rule is the part most humans miss — you tend to fixate on whichever segment looks worst in absolute terms, but the right target is the segment that is anomalously bad relative to its own channel peers. Same data, different lens.
Step 4: Cross-segment by device, browser, and OS
If the leak survives the source/medium breakdown, the next axis is almost always device. Repeat the same segmentation, but break down by Device category, then Browser, then Operating system. For most B2B funnels, the answer here is stark: mobile is leaking at 2-3x the rate of desktop, and within mobile, in-app browsers (LinkedIn, Facebook, Twitter) are leaking 2x again.
For the client above, mobile accounted for 61% of traffic but 84% of the step 2 → 3 drop. Within mobile, the breakdown by Browser showed a single culprit: Facebook's in-app browser. The drop rate from cta_click to signup_start in Facebook's in-app browser was 91%, versus 67% for Safari mobile and 62% for Chrome mobile.
This is a known issue with Facebook's in-app browser — it strips certain JavaScript behaviors, doesn't support the same window.open patterns, and has a different session-storage behavior. None of that would have shown up in any URL-based funnel. The whole investigation took 18 minutes from the moment I opened the device breakdown. The fix was to detect Facebook's in-app browser and force-open the signup page in the user's default browser, which dropped the step 2 → 3 leak on that segment from 91% to 71% in the first week. Not perfect, but it recovered 218 net signups over the next 30 days. The CEO's email back was longer than four words that time.
Step 5: Add the qualitative layer
Quantitative data tells you where. It does not tell you why. After step 4 you have a tight, narrow hypothesis — "Facebook in-app browser is breaking the signup flow" — but you still need to confirm that the cause is what you think it is, not a different cause that happens to correlate. This is where most analysts stop, and most analysts ship the wrong fix.
Pull three qualitative sources, in this order of cost-effectiveness:
- Session recordings if you have them — Microsoft Clarity is free and works on a 4-event custom trigger. Watch 10-15 sessions from the leaking segment. Don't summarize. Watch them. The cause of a 91% drop is almost always visible in the first 4 seconds of the recording.
- On-page survey (a 1-question Hotjar poll, or a 2-field form, fired only to users who reach the leaking step). Ask: "What stopped you from completing this step?" Free-text answers cluster fast. Five answers of "I got redirected to Facebook" tells you what the recordings would have.
- Support tickets and chat logs filtered to the leaking step. A spike in "the page is broken" or "I can't sign up" from the same segment is a direct confirmation.
For the client, session recordings showed the same pattern in 11 of 12 watched sessions: the CTA click opened the signup URL inside Facebook's stripped browser, the page rendered, but the form's first focus event never fired. Engineering confirmed it was a known compatibility issue with how react-hook-form (a React form library) initializes state inside Facebook's WebView. The qualitative layer didn't just confirm the hypothesis — it told engineering exactly where to patch.
Step 6: Use Claude to draft the testable hypothesis
By step 6 you should have a working theory, but it lives in your head. Get it out of your head. I use a Claude prompt to compress the diagnosis into a single testable hypothesis with explicit pass/fail criteria. The structure I use is the same one I use for campaign post-mortems:
Given the following funnel data, session recording observations, and qualitative feedback, draft a single testable hypothesis. Format: (1) Belief — one sentence stating what I think is happening, (2) Evidence — three bullet points citing the data and observations that support it, (3) Counter-evidence — the strongest argument against this hypothesis, (4) Test — a 7-day experiment that would confirm or kill this hypothesis, with the exact metric threshold for "confirmed," (5) Owner — the single person responsible for the test. Keep it under 200 words.
The Counter-evidence step is the part I added after watching too many "diagnoses" turn into confirmation bias. Forcing the model (and yourself) to write down the strongest reason you might be wrong catches about a third of the hypotheses I would have shipped. In the client case, the counter-evidence was: "Maybe Facebook in-app browser users are simply less qualified — the ad targeting is bringing in lower-intent users from Facebook specifically." A real possibility. The test was: serve identical signup flow to Facebook in-app users who bypass the in-app browser (via the deep-link fix) and compare completion rate against the same segment in the control group. If the fix moves the in-app completion rate to within 5 percentage points of the desktop rate, the browser is the cause. If it doesn't, the targeting is.
Step 7: Run the test and write the lesson
If your test confirms the hypothesis, ship the fix and re-measure. If it doesn't, do not relitigate the data — go back to step 4 and try a different segmentation. A failed hypothesis is a real result: it tells you the cause is on an axis you haven't examined yet, which narrows the next round.
Whether the test passes or fails, write a one-page "lesson" — not a post-mortem, just a single page with: the original funnel, the step where the leak was, the segment it was concentrated in, the hypothesis, the test, the result, and the permanent instrumentation you added so this leak can never sneak back in silently. The last bullet is the most important. A funnel diagnosis that doesn't end in instrumentation is a one-time fix, not a system. Most "we fixed the funnel" stories I've read end with the same funnel breaking 18 months later because nobody thought to add an alert.
In the client's case, the fix shipped, the segment's drop rate fell from 91% to 71%, and we set a Looker Studio alert to fire if the step 2 → 3 rate on Facebook in-app ever climbs back above 80%. That alert has saved them from two regressions since — once when a JavaScript library update re-broke the focus event, once when their ad agency re-targeted the Facebook campaign toward a colder audience without telling anyone. Both times, the alert fired before the daily standup.
The two traps I keep falling into
Even with this framework, I still make the same two mistakes. The first is stopping the diagnosis at the first plausible cause. A 91% drop is dramatic, and once you find a single segment that's responsible, your brain wants to declare victory. Resist it. The most expensive funnel issues I've seen are the second or third cause hiding behind the first one. Always run step 5 even when step 4 feels conclusive — the qualitative layer is what separates a hypothesis from a fact.
The second is ignoring segments that are too small. GA4 will sometimes tell you a particular OS version or browser version is leaking at 100% with only 47 users in it. It is tempting to discard it as noise. Don't. A 100% drop on 47 users is still 47 lost conversions, and sometimes those 47 users are early adopters, press, or high-value accounts whose word-of-mouth is worth more than the conversions themselves. Investigate anything where the rate is more than 2x the channel average, regardless of absolute volume. The volume tells you how urgent; the rate tells you what is real.
The goal of a funnel diagnosis is not to find the leak. The goal is to build a system that finds the next leak for you, before your CEO has to ask the question.