Cohort Retention Without a Data Team: Claude + Klaviyo/Shopify SQL You Can Actually Read
Contents
Last month I watched a 30-person DTC brand argue in Slack for three days about whether their email automation was working. One side said "we have 18% repeat purchase rate" and the other said "our repeat rate is 9%." Both were using the same Klaviyo dashboard. Both were right — and both were wrong. The problem was that the metric they were arguing about was a single number averaged across every customer ever, which is almost useless for deciding what to do next.
Cohort retention is the answer. It's also the analysis that most marketers outsource to a data analyst, which means it usually doesn't happen. Here's how I get it done in about 15 minutes using Claude, Klaviyo data, and Shopify data — with no SQL background required to read the output.
Where the data lives
Two sources matter for an ecommerce cohort retention table:
Shopify (your source of truth for orders and customer identity)
customers— one row per person, hasid,email,created_at(when they signed up or first ordered)orders— one row per transaction, hasid,customer_id,created_at,total_price,financial_statusrefunds— for cleaning out refunded orders before counting retention
Klaviyo (richer behavior data — opens, clicks, browse, etc.)
Placed Order— the conversion event, includes$valueandItemNamesOrdered Product— line-item level- Profile properties — including
first_seen(when Klaviyo first identified the profile) andSource(the signup source if you're tagging it)
For retention you only need the order events. Klaviyo is great for behavioral cohorts ("everyone who clicked the new-arrivals flow"), but for plain revenue retention Shopify is faster.
The prompt
This is the part most people get wrong. They paste "write a cohort retention SQL query" into Claude and get a working query that they cannot read. The fix: ask Claude to do the explaining as it writes.
Here's the prompt I use:
You are a senior data analyst writing SQL for a non-technical marketer. Write a BigQuery (or PostgreSQL — pick yours) cohort retention query for my Shopify + Klaviyo data.
Requirements:
- Use only these tables:
[list your tables]. Use only these columns:[list them].- Comment every line of the query — I need to read it without SQL knowledge.
- Use CTEs (WITH ... AS) named in plain English, not abbreviations.
- Alias every output column with a name a marketer would say out loud (e.g.
month_0_repeat_ratenotm0_rr).- Output a cohort matrix: rows are monthly acquisition cohorts, columns are months 0, 1, 2, 3, 4, 5, 6 since first order, values are the % of the cohort that placed another order in that month.
- Add a final query at the bottom that does NOT include the SQL — a plain-English reading guide explaining what each column means and the 3 numbers a marketer should look at first.
Sample data shape:
[paste 3-5 sample rows from your tables here].
The two lines that do the heavy lifting are #2 and #6. They force Claude to teach you while it works. The result is a 60-80 line query with a comment on every meaningful line, and a separate English paragraph next to it that says "look at column M1 first — that's your first-month repeat rate."
What the output actually looks like
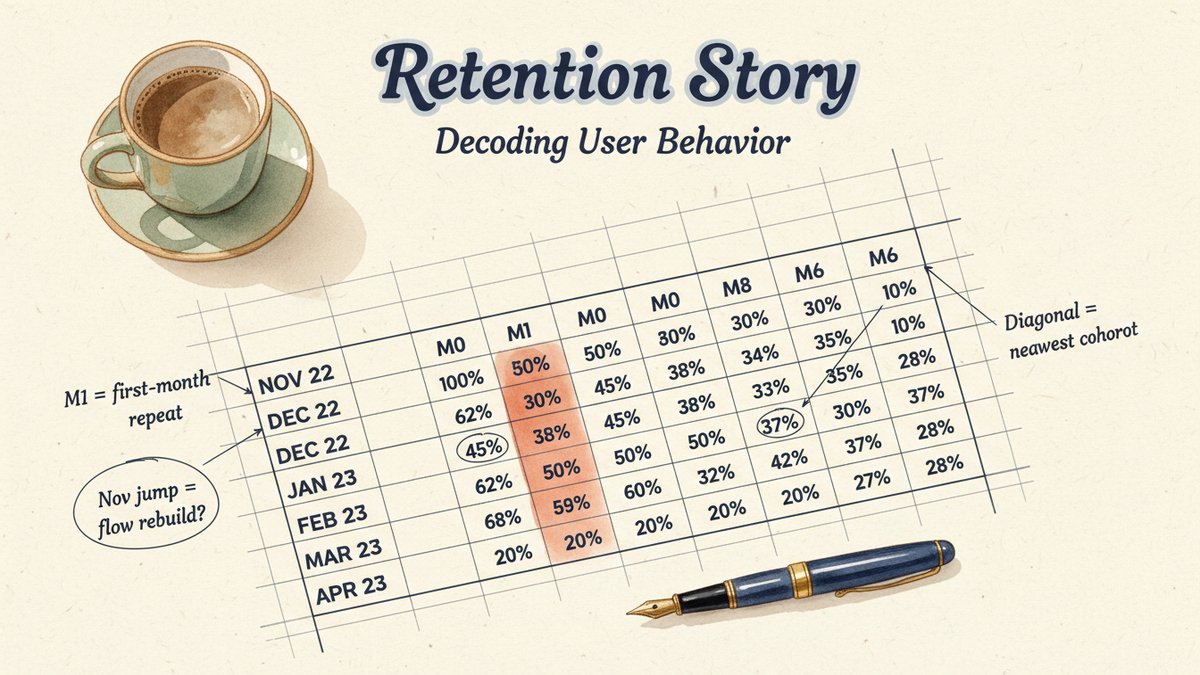
Say you run that for your last 12 months. You'll get a table that looks like this (illustrative, not from a real client):
| Cohort | Size | M0 | M1 | M2 | M3 | M4 | M5 | M6 |
|---|---|---|---|---|---|---|---|---|
| 2024-08 | 1,420 | 100% | 12% | 18% | 21% | 23% | 24% | 25% |
| 2024-09 | 1,610 | 100% | 14% | 20% | 23% | 25% | 26% | — |
| 2024-10 | 1,890 | 100% | 11% | 17% | 19% | 21% | — | — |
| 2024-11 | 2,310 | 100% | 15% | 22% | 25% | — | — | — |
| 2024-12 | 2,580 | 100% | 16% | 24% | — | — | — | — |
A few things to notice in the shape:
- The cohort size is growing. More customers every month — good.
- M0 is always 100% by definition (everyone in the cohort made a first order, that's how they got in).
- M1 (the first column that actually means something) is the rate that matters most.
Reading the output as a non-data marketer
Three things to look at, in order:
1. M1 — the first-month repeat rate. This is the single most actionable number in the table. If your M1 is below 15%, your post-purchase email flow is broken or your product is wrong. Anything above 20% is healthy for most DTC categories; above 30% is exceptional. In the example above, M1 was stuck at 11-16% for half a year, then jumped in November. What changed? Probably a flow rebuild. The data tells you it worked.
2. When the curve flattens. Look down each cohort's row. The percentage will climb and then level off — that level is roughly your "lifetime repeat rate" within the window. If it flattens at 20%, about 1 in 5 customers will ever buy again. If it flattens at 40%, you're sitting on a real brand. The shape of the curve (how fast it flattens) tells you about purchase cycle. Slow flattens mean long consideration; fast flattens mean consumable.
3. Cohort-over-cohort trend. Read the M1 column top to bottom. Is it going up, down, or flat? If it's going up over time, your acquisition is getting better (or your product is improving) — even if last quarter's revenue is flat. If it's going down, your top-of-funnel is bringing in worse customers, and the next quarter's revenue is in trouble before the orders even arrive.
A marker most people miss: the diagonal. The empty cells in the bottom-right are not missing data — they're cohorts that haven't lived long enough yet to have an M6. M0 is in the present, M6 is six months in the past. So a row with only M0-M2 is your newest cohort. That's how you know what "this month" looks like.
Pitfalls I've learned the hard way
- Don't include refunded orders in the cohort denominator — count only completed orders (
financial_status = 'paid'or non-refunded). Otherwise a refund-heavy month looks like a retention disaster. - Don't mix guest checkouts and logged-in customers without deduplicating by email. Shopify will let the same person have two
customer_ids. - Don't run this on Klaviyo's
Placed Orderevent if your Shopify timezone and your Klaviyo timezone differ. M0 jumps in the wrong month. Pick one source of truth for "when did this happen." - Don't ask for a 24-month cohort window until you've run a 6-month one first. The longer the window, the more assumptions about seasonality you're baking in. Start small.
What this is actually for
The reason to learn this isn't to stop using your data team. It's to stop being blocked by them. The whole argument I watched in Slack at the start would have ended in one minute if the email manager had pulled this table herself. She didn't need a 1,000-row analysis — she needed to see that M1 had been falling for three months, which would have prompted her to open the post-purchase flow in Klaviyo and look at the actual emails.
That's the real shift. Cohort retention stops being a deliverable and starts being a habit. And the cost of building the habit just dropped to one good prompt.