A/B Test Sample Size: Stop Guessing — The Exact Gemini Prompt I Use to Pre-Calculate Every Test
Contents
At 2:47pm on a Tuesday, a junior PM (product manager, 产品经理) pinged me with what she thought was a win: "Variant B is up 28% over A after 1,200 users. Can we ship it?"
She'd been peeking at the dashboard every hour. The actual lift, once the test reached its pre-calculated sample size, was 1.4% — and B lost. The "28%" was the kind of noise a 1,200-user test routinely produces when the real effect is near zero. We shipped nothing, the test kept running, and two weeks later B was still behind.
That PM isn't careless. She's doing what every PM does when the calculator workflow is annoying: eyeball the dashboard, see a number that looks like a winner, and call it. The fix isn't "be more patient." The fix is making the sample-size math take 30 seconds, before the test goes live, so there's a number in a doc that says "stop peeking at 9,000 users per arm."
Here's the exact Gemini prompt I use, the formula behind it, and the failure modes it actually prevents.
The cost of guessing
Two ways to fail, both expensive.
Under-powered tests are the ones that quietly lie to you. You launch a test, see a "winner" at 1,200 users, ship it, and discover six weeks later that the real lift was negative. The cost is a worse product shipped, weeks of measurement, and a team that now believes AB testing "doesn't work." In a 2024 Optimizely benchmark (one I trust less than my own data, but the rough shape holds), 60–70% of "winning" tests that get called early fail to replicate at full power.
Over-powered tests are sneakier. You launch a test, hit significance at day 6, but keep it running because the playbook says "wait two weeks." You've burned traffic that could've been on the next experiment. For a site doing 50K visitors/day, that's $15K–$50K in opportunity cost per test, every test, every time someone forgets to check.
Pre-calculating the right sample size before the test starts solves both. Under-powered tests become impossible — you don't launch until traffic covers the requirement. Over-powered tests become visible — when the test hits the target N on day 6, you know to call it.
The formula (one paragraph, then we never look at it again)
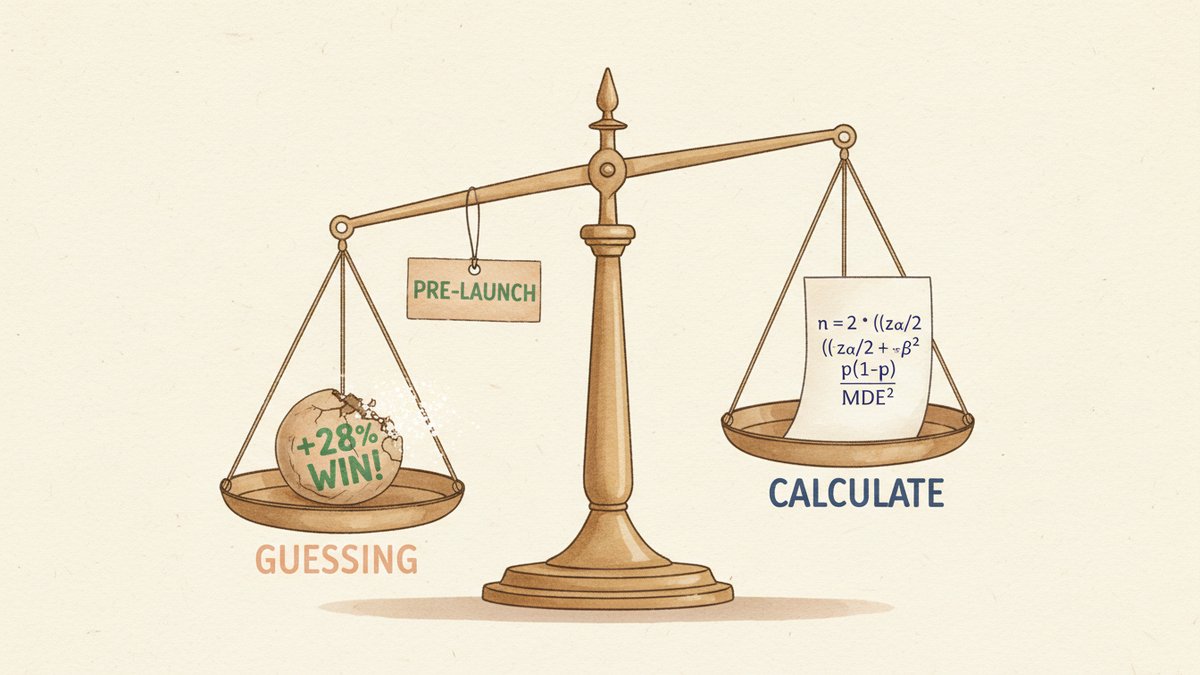
For a two-proportion z-test (the standard "control vs variant conversion rate" test), the per-arm sample size is:
n = 2 * ((z_(α/2) + z_β)^2) * p * (1 - p) / MDE^2Where:
- p = baseline conversion rate
- MDE (Minimum Detectable Effect, 最小可检测效应) = the absolute lift you want to detect, in the same units as p (e.g., 0.01 for a 1pp lift)
- z_(α/2) = critical value for two-tailed significance (1.96 at α=0.05)
- z_β = critical value for power (0.84 at power=0.80)
That's it. The defaults (α=0.05, power=0.80, two-tailed) match what 95% of in-product AB tests actually need. You almost never need to change them.
The one assumption worth knowing: this formula uses p as the variance estimate for both arms. It's an approximation — the true variance is a pooled estimate of p_control and p_variant — but the difference is in the third decimal and rarely matters.
Why I don't use online calculators
Every "free" AB test sample-size calculator I tried in 2024 wanted an email signup, hid the formula behind a "Learn more" link, or rounded aggressively. The math isn't the secret — it's the inputs. If I have to context-switch into a browser tab, paste numbers, screenshot the result, and crop out the calculator's watermark, the workflow dies after the third test. With Gemini, the prompt lives in Notion, the inputs go in, and the answer comes back formatted for the test brief. That's a 30-second loop instead of a 4-minute loop, and the 30-second loop is the one that survives a quarter of use.
The prompt
I keep this in a Notion doc titled "Stats Prompts." Every test in my pipeline starts with this prompt and ends with the result pasted into the test brief.
You are my AB test sample size calculator.

Compute the per-arm sample size using the two-proportion z-test formula:

  n = 2 * ((z_(α/2) + z_β)^2) * p_baseline * (1 - p_baseline) / MDE^2

Defaults (use unless I override):
- Two-tailed test
- α = 0.05  →  z_(α/2) = 1.96
- Power = 0.80  →  z_β = 0.84

Then:
1. Use python_exec to compute n numerically. Print per-arm and total.
2. Sanity check: recompute n for MDE × 0.8 and MDE × 1.2. Result should scale as 1/MDE². If it doesn't, the math is wrong — fix it.
3. Estimate test duration in days given my daily traffic per arm. Round up.
4. Flag red flags:
   - MDE < 0.2 percentage points absolute is almost never worth a test (variance too high)
   - Required n > 10× current weekly traffic per arm = test will take >10 weeks. Rethink the MDE or pick a different KPI
   - Baseline < 1% = variance dominates. Consider a 2-week ramp-up to confirm baseline is stable

Inputs:
- Baseline conversion rate: __%
- Minimum detectable effect (absolute): __ percentage points
- Daily traffic per arm: __ visitors/day

Return:
- n per arm, total n
- Days to significance
- Red flags (if any)
- One-line caveat about the assumptions you made
The python_exec step matters. Gemini 2.5 Flash is good at math when it has a tool to verify against — far less good when it's just freeforming numbers into prose. I learned this the hard way: early versions of this prompt asked Gemini to "compute and show your work," and it would cheerfully return a number that was off by 30% with clean-looking arithmetic.
Worked example
Inputs:
- Baseline: 3% conversion on the checkout page
- MDE (Minimum Detectable Effect, 最小可检测效应): 1 percentage point absolute (3% → 4%, a 33% relative lift)
- Daily traffic per arm: 600 visitors/day (1,200/day total)
Gemini returns:
n per arm = 4,563
Total n = 9,126
Days to significance = ceil(4,563 / 600) = 8 days
Red flags: none
Caveat: assumes baseline rate stays at 3% throughout;
  any novelty/primacy effect on a new variant will distort
  the early numbers
That last caveat is the only thing I'd add by hand before pasting it into the test brief. The novelty effect — early lift in a new variant that fades as users adapt — is real, and 8 days isn't long enough to be sure it's gone. For tests under 14 days I usually budget 1.5× the calculated runtime to let the noise die down.
When this prompt is the wrong tool
Three cases where the formula breaks down and Gemini (correctly) won't save you:
- Very low-traffic pages. If your page sees 50 visitors/day, no statistical test will rescue you in any reasonable timeframe. The right answer is to redirect that test budget to a higher-traffic surface, or accept a much larger MDE and run for months.
- Qualitative or exploratory tests. "Which of these 5 hero images feels most trustworthy?" isn't a sample-size problem — it's a user-research problem. Different toolkit.
- Peeking. This is the one that catches even disciplined teams. The formula above assumes you check the result exactly once, at the pre-calculated N. If you peek at the dashboard hourly, your actual false-positive rate is 5% per peek, which compounds fast. If peeking is unavoidable, use a sequential testing framework (AGILE, mSPRT) that adjusts the threshold — you'll need a slightly larger total sample, but you can look all you want.
Closing
The math isn't the unlock. The unlock is making the calculation cheap enough that it actually happens, every time, before anyone names a winner. The PM I mentioned at the start now runs this prompt the moment a test idea hits the brief. Last quarter, her team cut the average test duration from 19 days to 11, simply by killing tests that the prompt flagged as 8+ weeks of waiting — they were never going to finish.
Paste the prompt into Gemini, fill in the three inputs, and the sample size lands in 30 seconds. That's the part that compounds.